Python Dashboard
The Problem
For my CSE 2050 (Data Structures) class, my group was tasked with building a backend University Information System from scratch. The challenge was to take raw, unstructured CSV data containing hundreds of student enrollments and process it efficiently. Standard spreadsheets fail to provide quick, relational insights—like finding course intersections, generating a Dean's List, or calculating university-wide grade statistics.
The Result
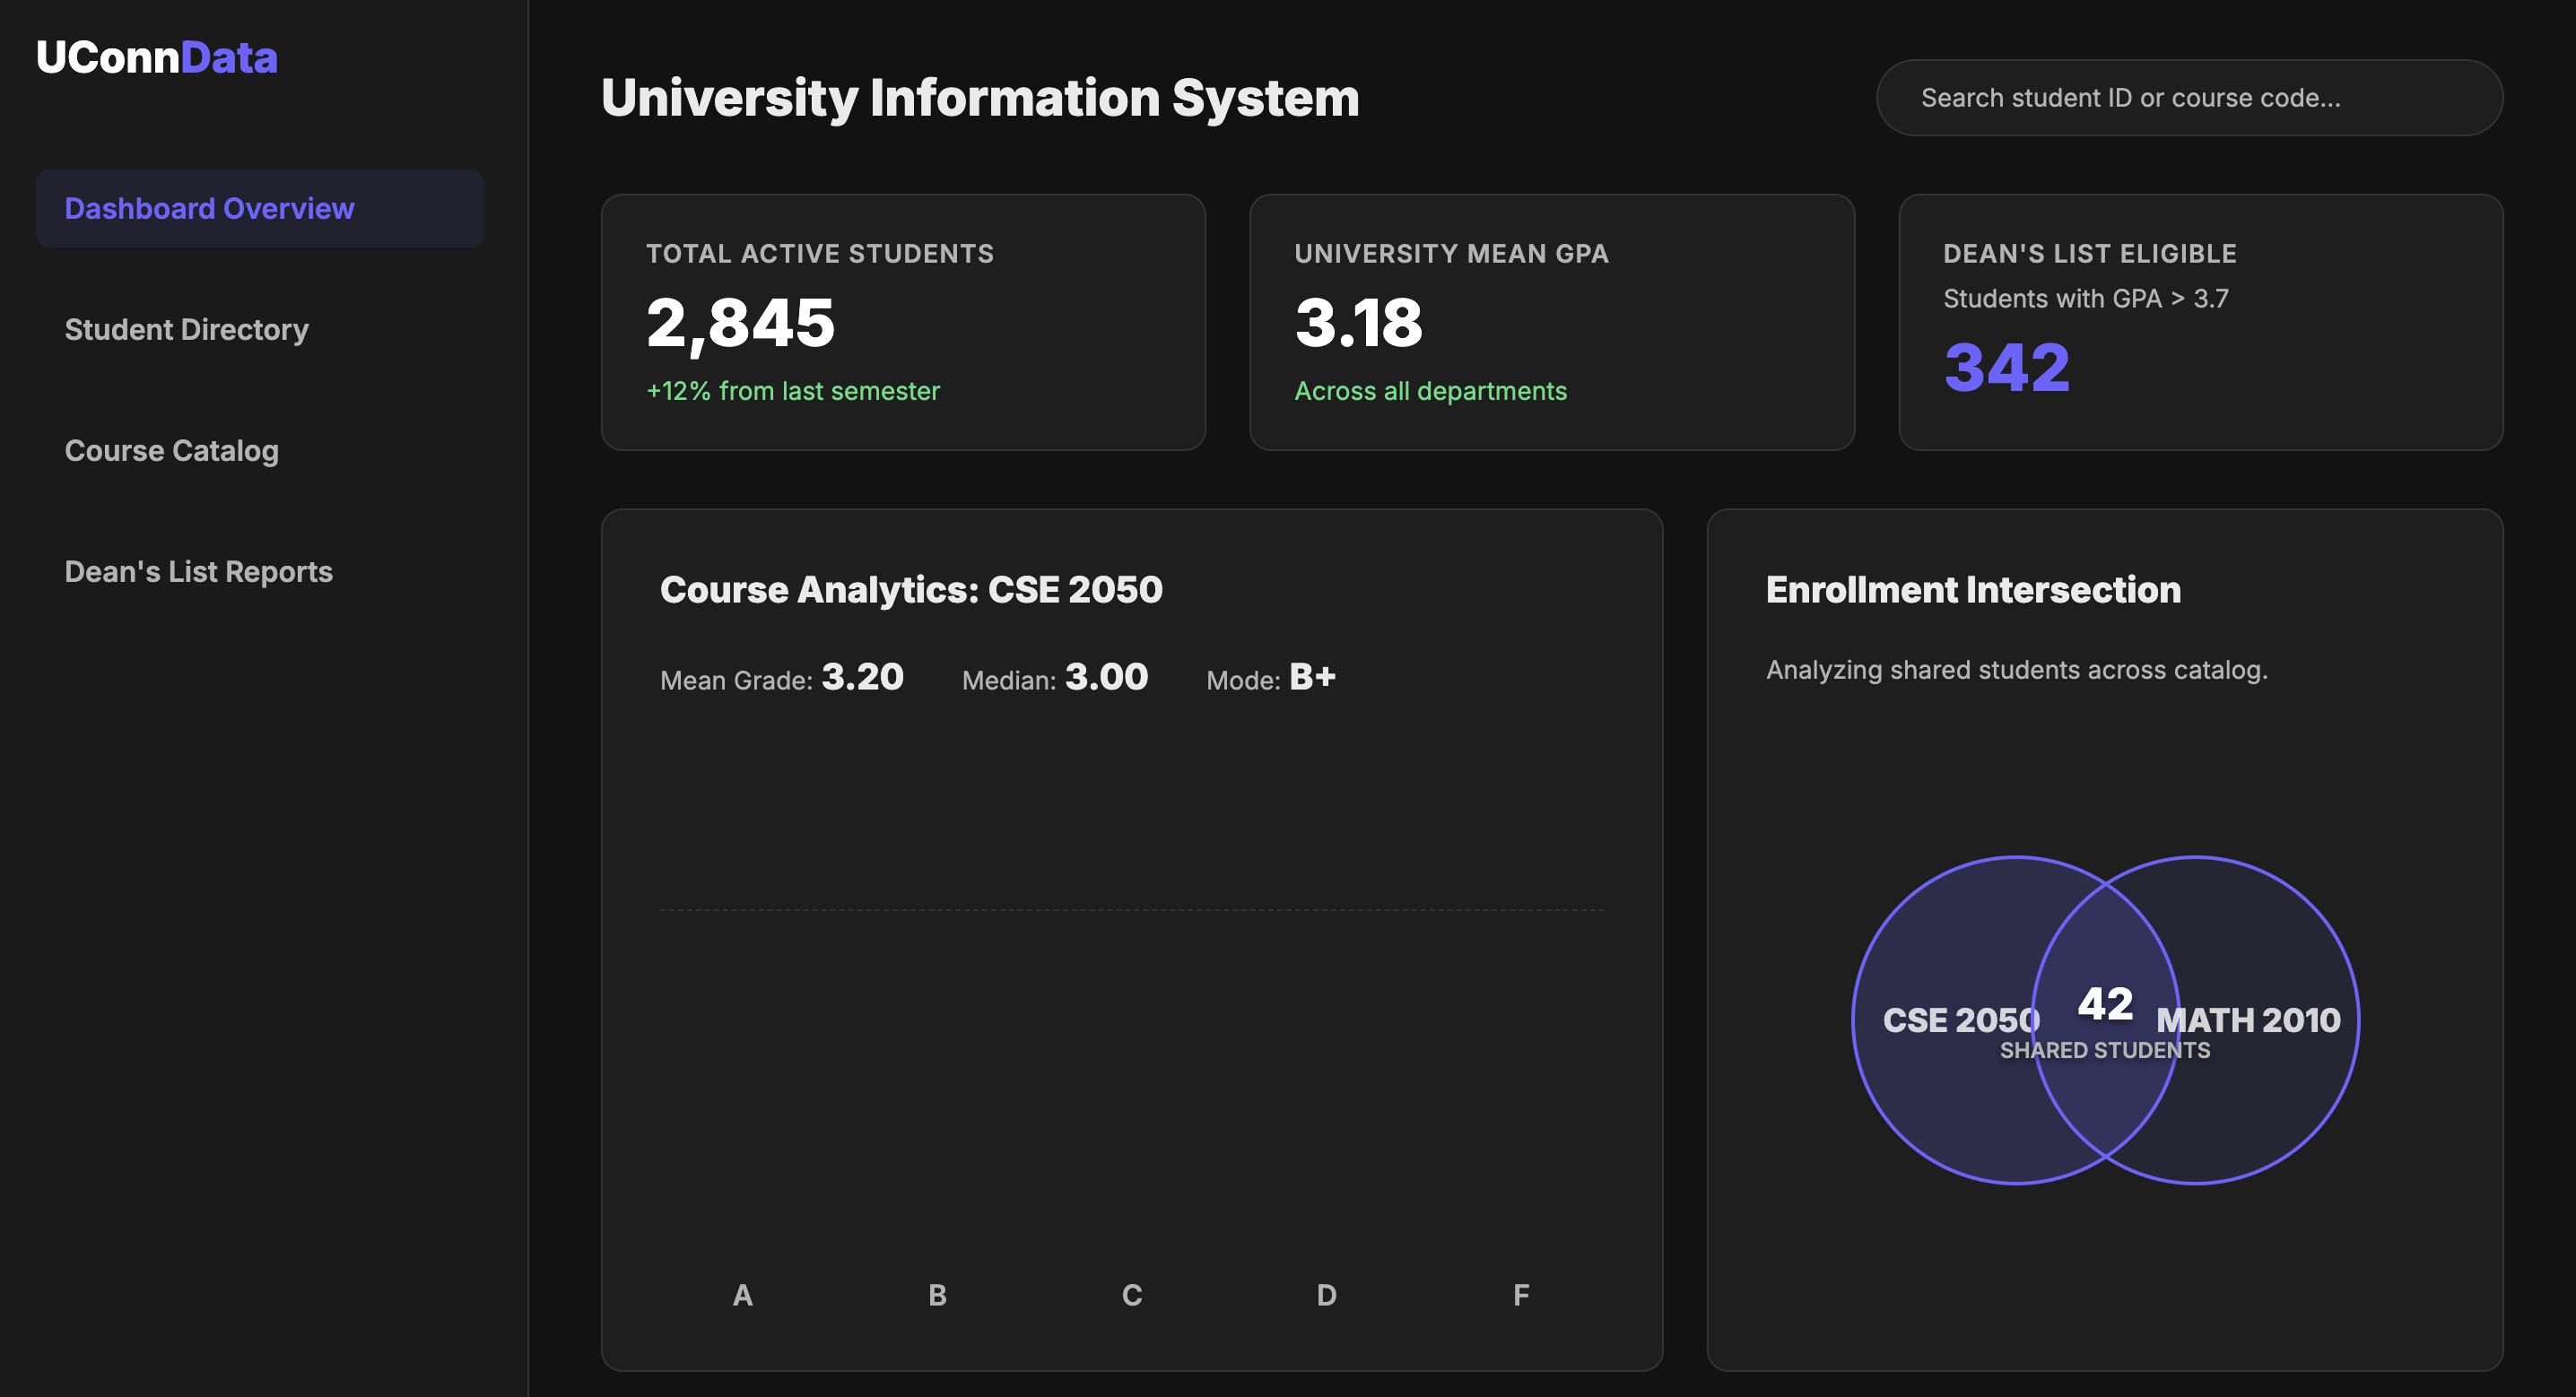
The final Python application successfully processes the raw CSV data through custom algorithms, outputting a structured, terminal-based data system. To bridge the gap between backend logic and human-centered design, I also designed a conceptual UI dashboard to visualize how this data would look in a live administrative web app.
The Process
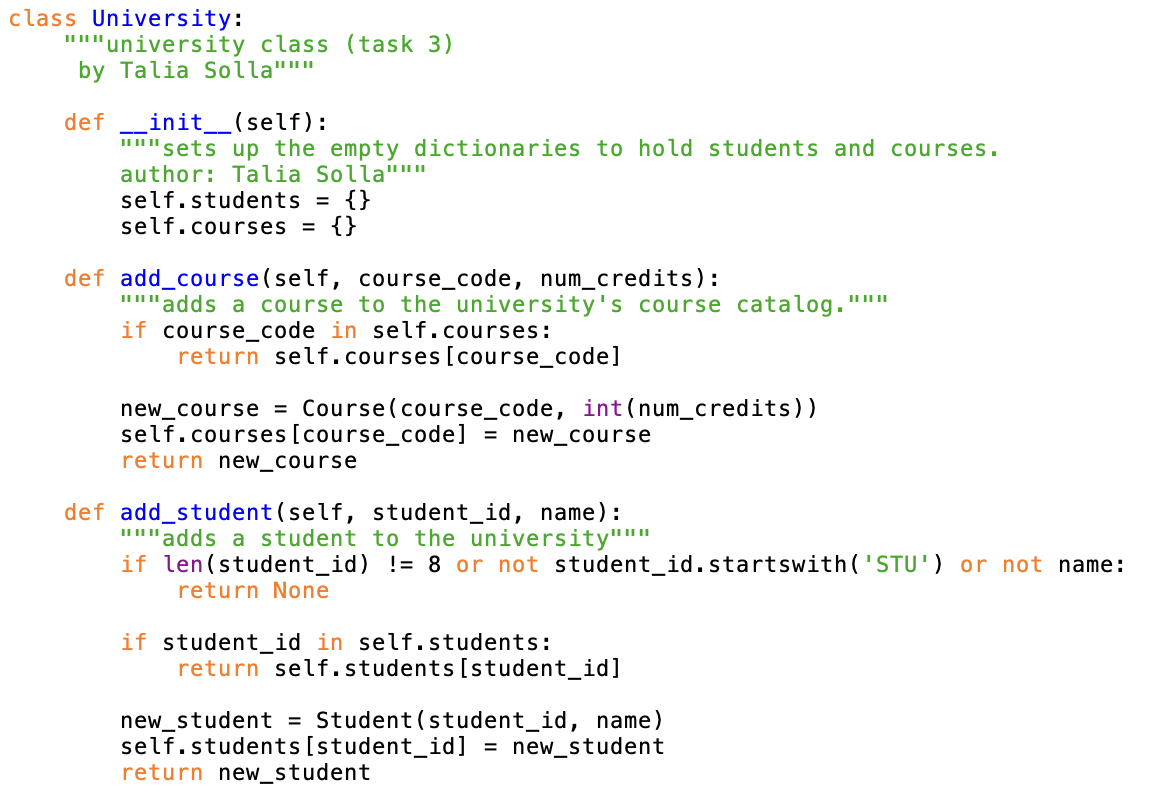
I collaborated with a team to build out a complex object-oriented architecture using Python. I specifically architected the core University class, utilizing advanced data structures like dictionaries to efficiently store and sort student and course objects.
Once the structural architecture was solid, I wrote custom logic to parse CSV data, calculate Dean's List eligibility, and find enrollment intersections between different courses. This project allowed me to perfectly blend complex backend data manipulation with clean, user-facing information design.